Unit Economics Graphs
Explore your unit economics at the level where execution actually matters: per customer, per application, per agent, or any boundary you define
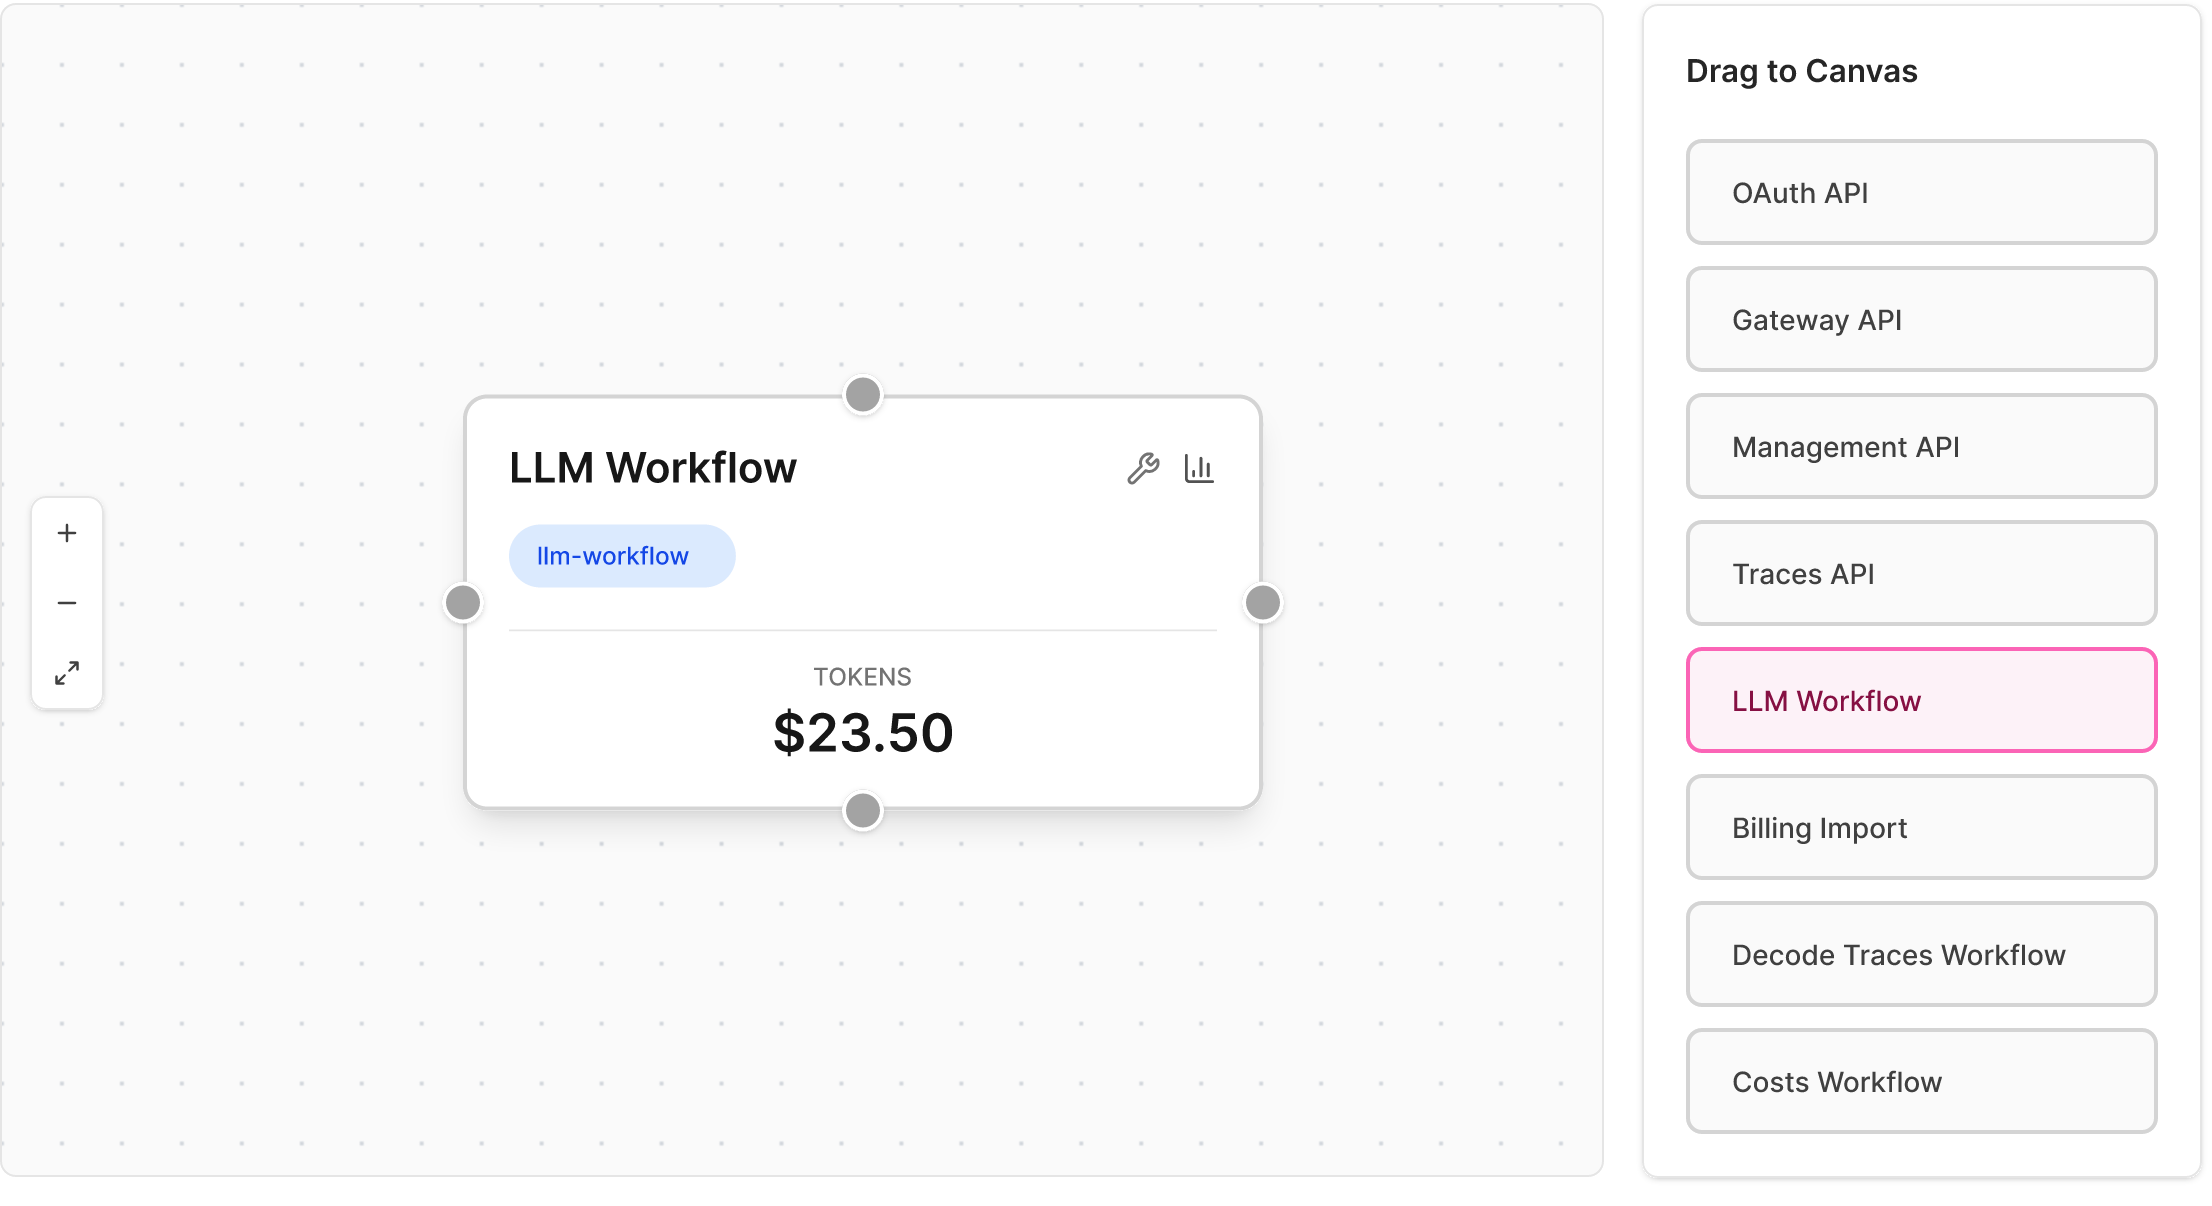
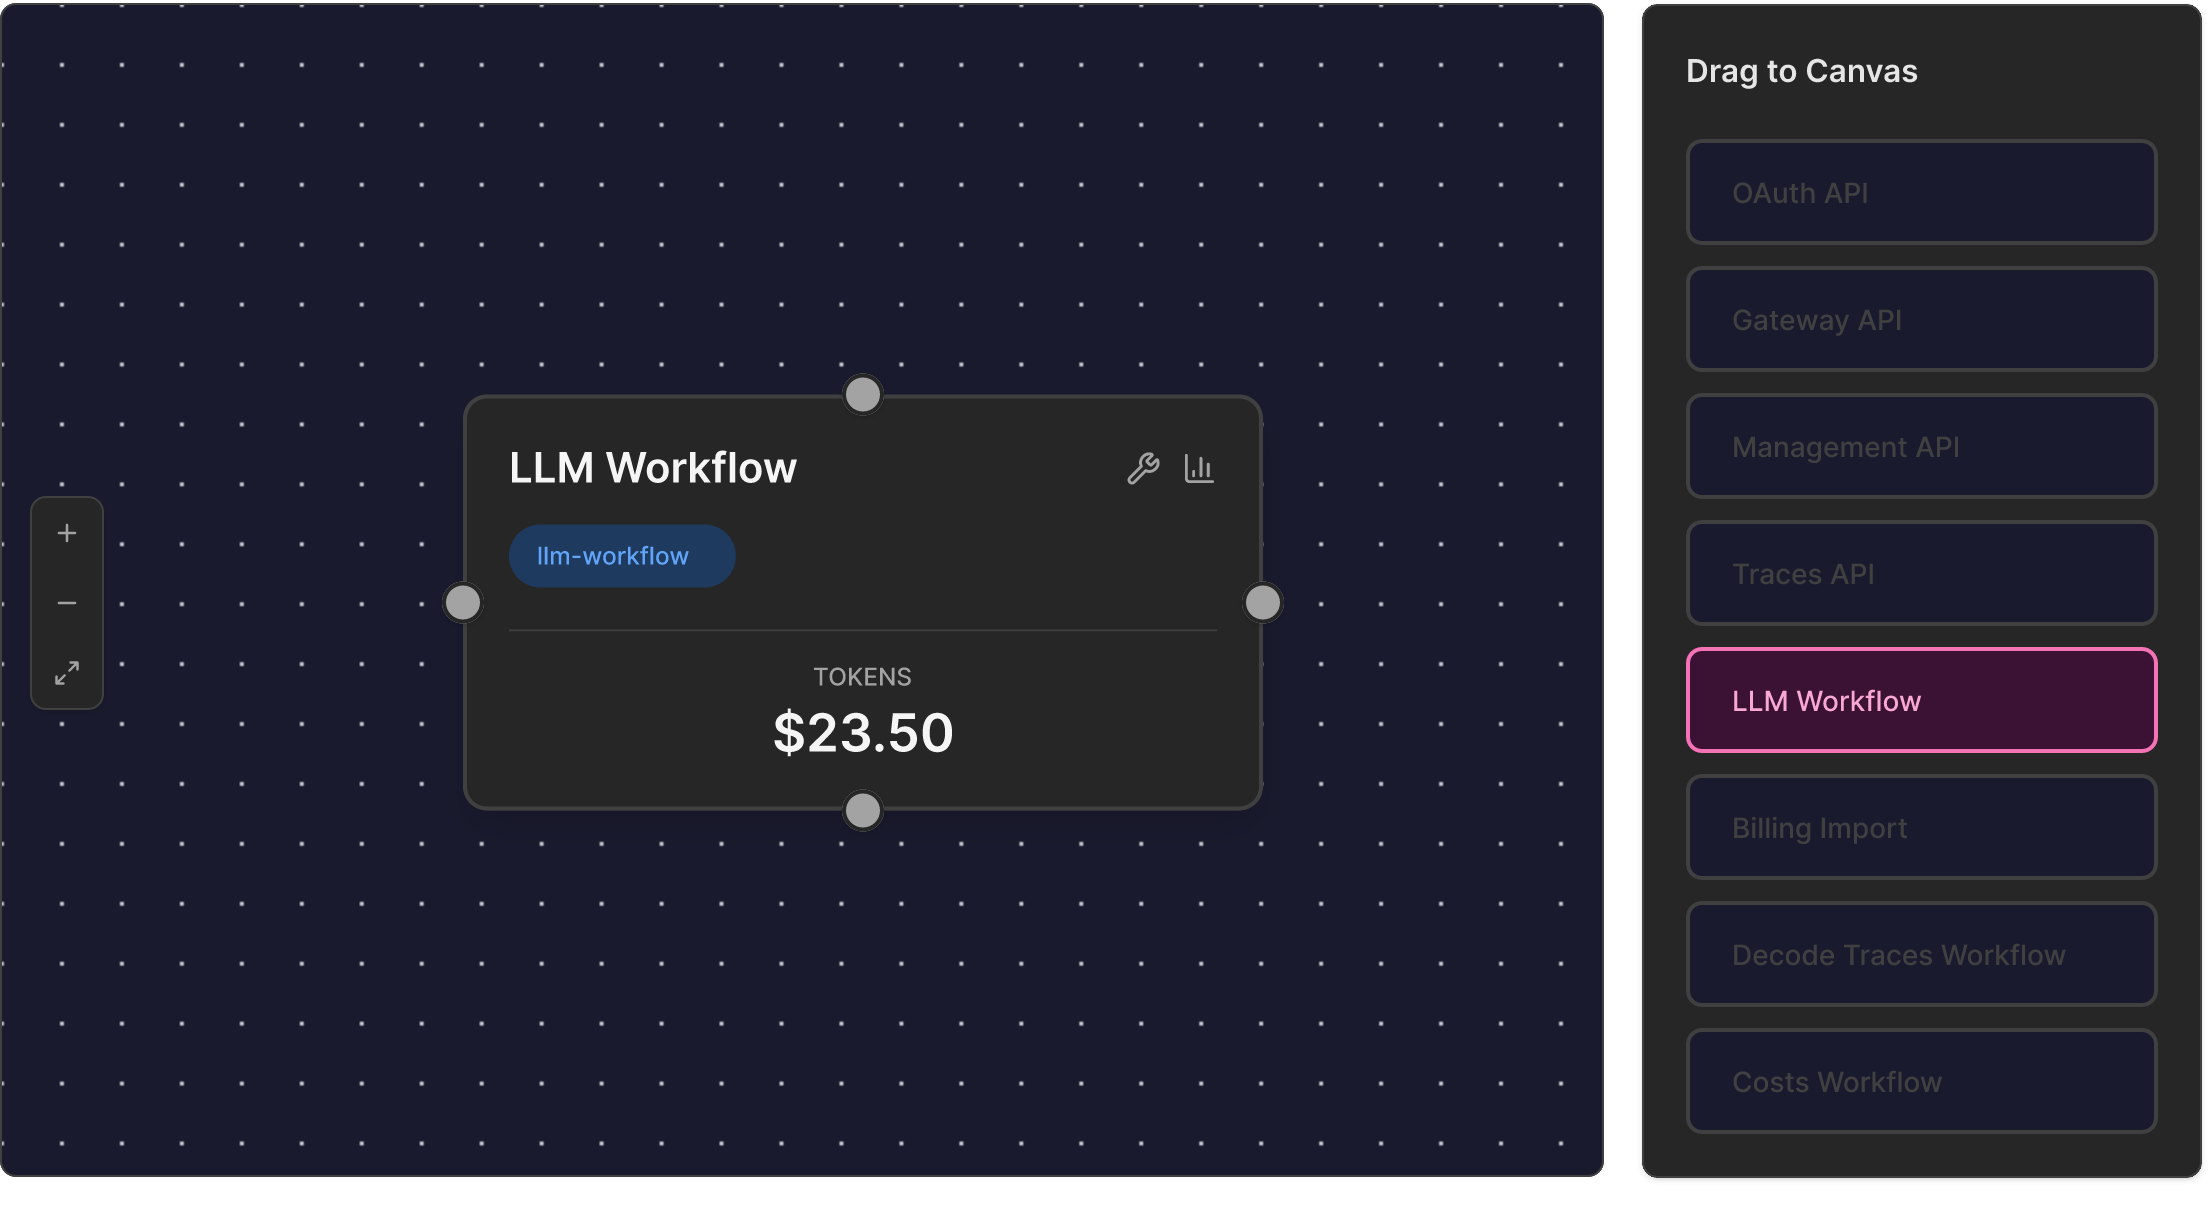
Create unit economics graphs
Build dedicated unit economics boards by dragging components onto the canvas to represent modules, services, or resources in your AI system.
Connect them to map the flow of cost and value across your entire AI system. The result is a queryable economic model that stays in sync with production, so you can attribute cost and measure the value each unit produces.


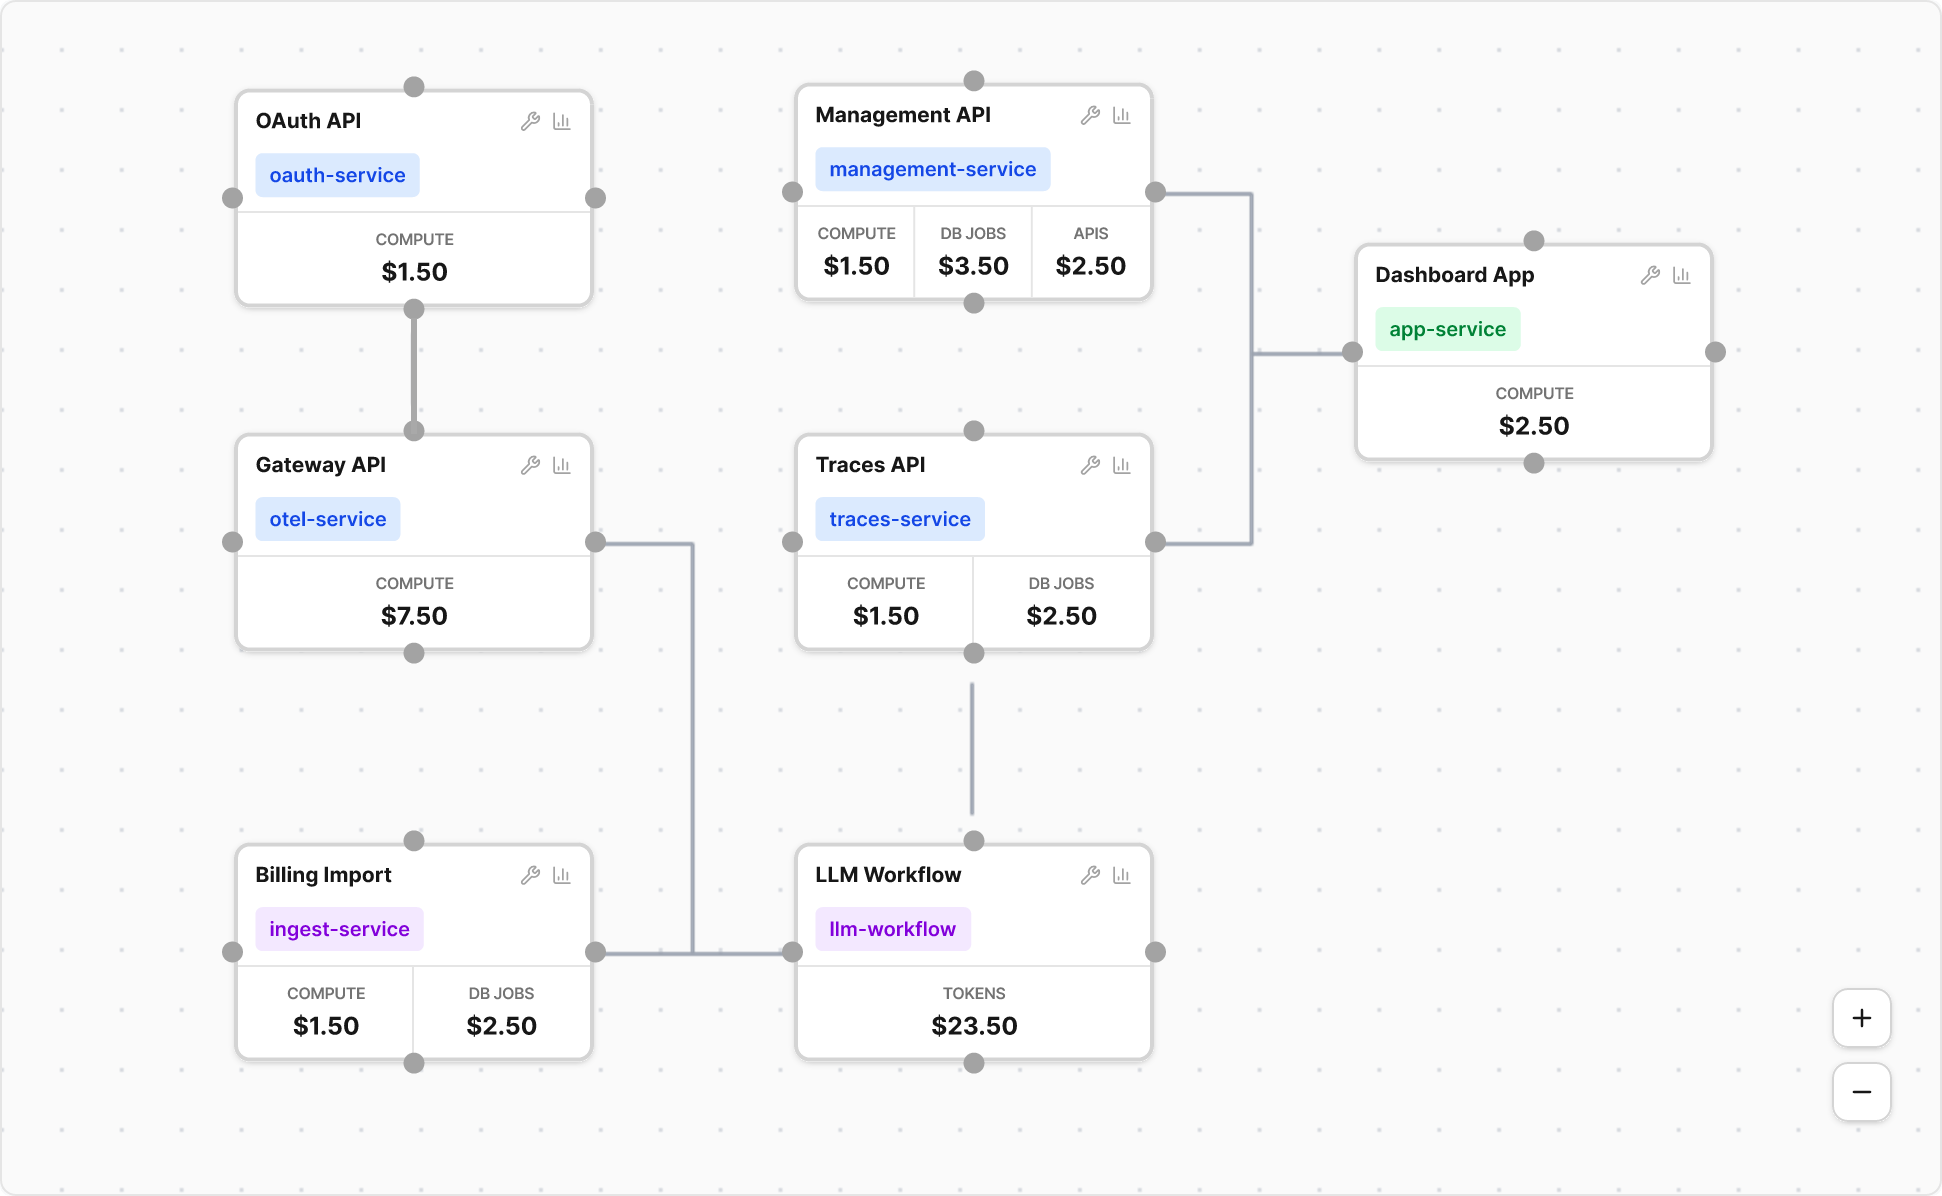

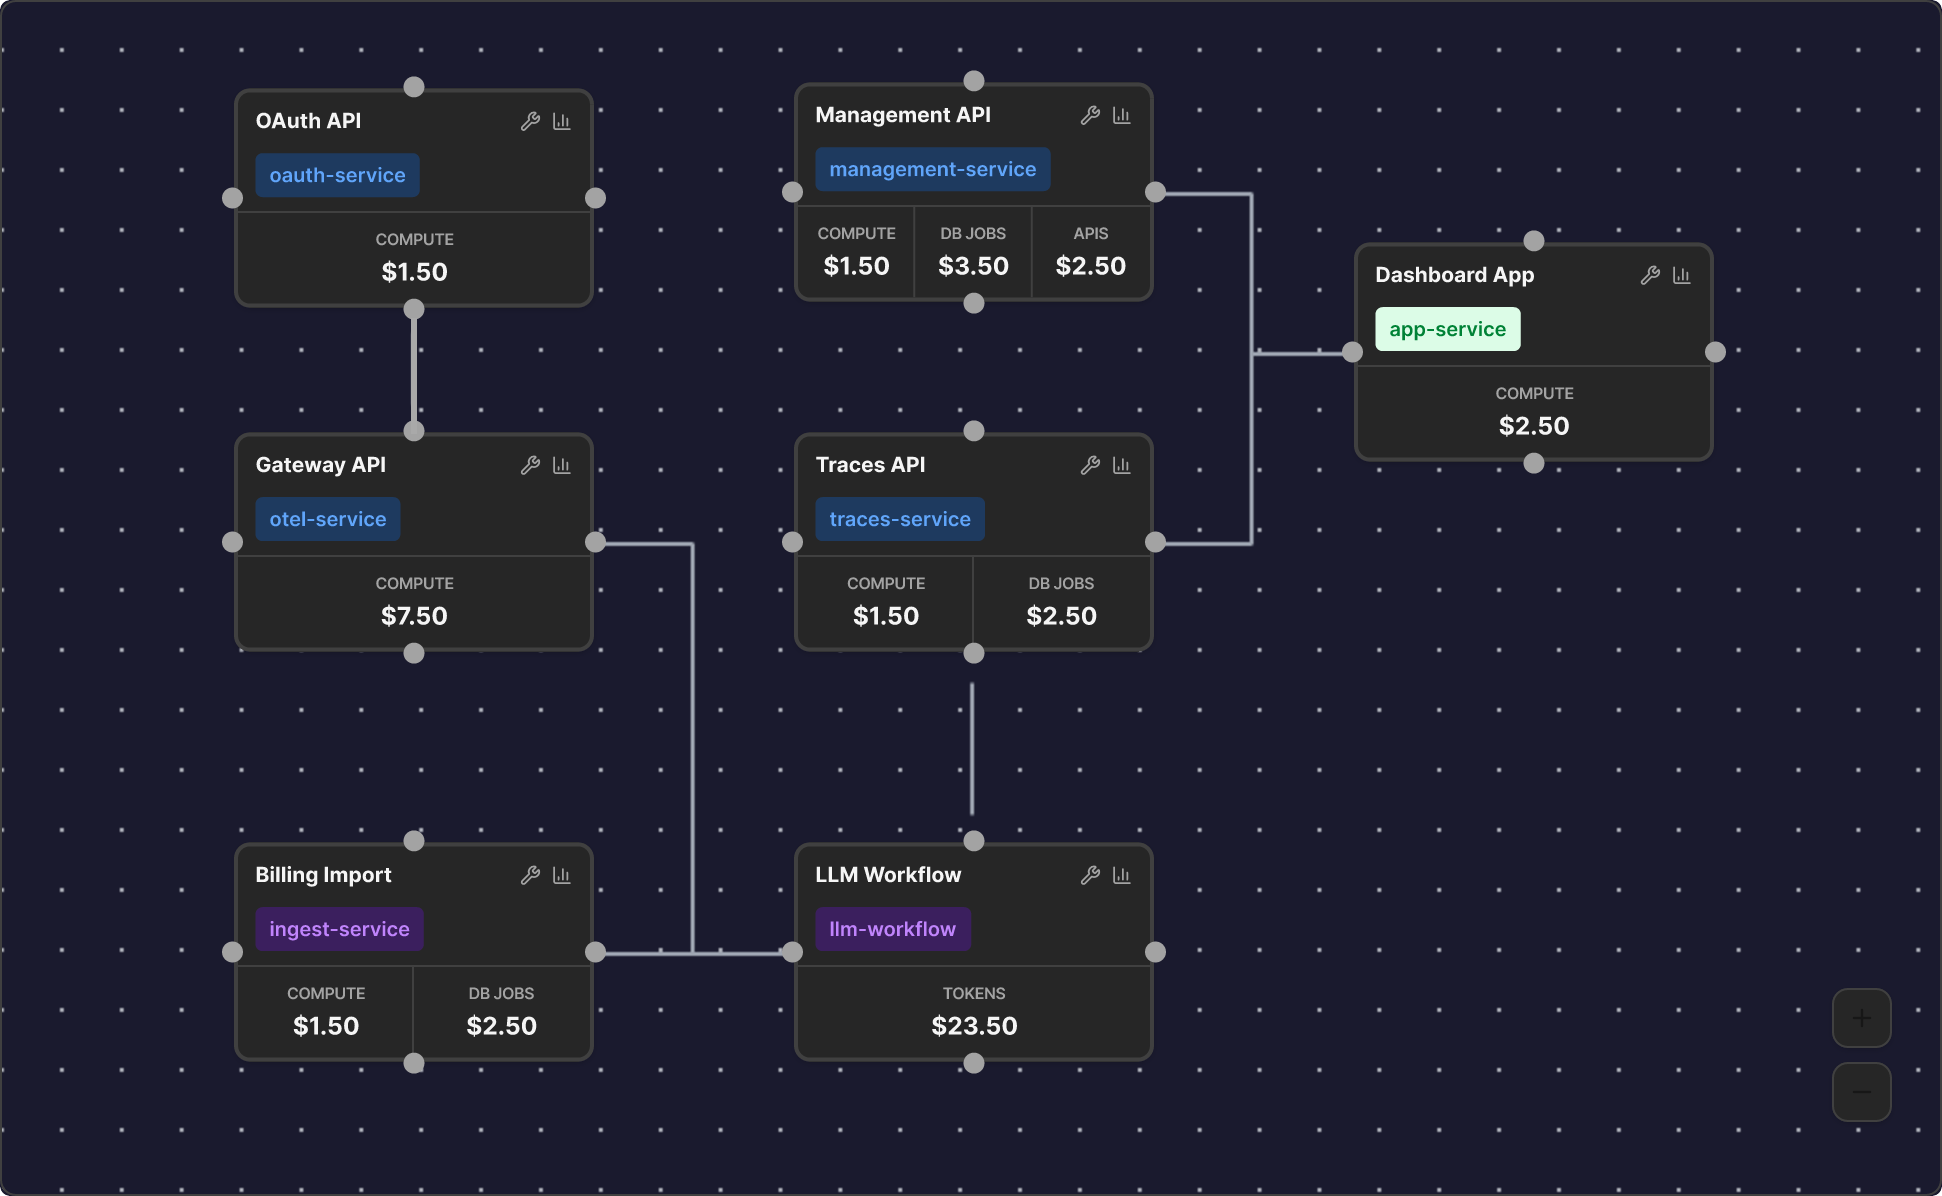

Navigate multi-level graphs
Link graphs together to model your system at multiple levels of abstraction. A top-level graph captures the product view: cost per tenant, per workflow, per agent. Drill into any node to reveal the services underneath, all the way down to individual API calls and model invocations.
Product, engineering, and platform teams each navigate the same economic model at the depth that fits their role, without needing separate dashboards or disconnected data.
Deep dive into graph traces & timeline
Every execution that flows through your graph produces a trace. Expand any trace to see exactly what happened: which services were hit, their associated costs, and the value they produced.
Switch to the timeline view to analyze how these metrics move over time. Identify exactly when a cost spike started, which service caused it, and how it propagated through the graph.
FREE for developers, forever.
Signup and connect your telemetry and billing pipelines to start tracking unit economics across your AI systems in minutes.